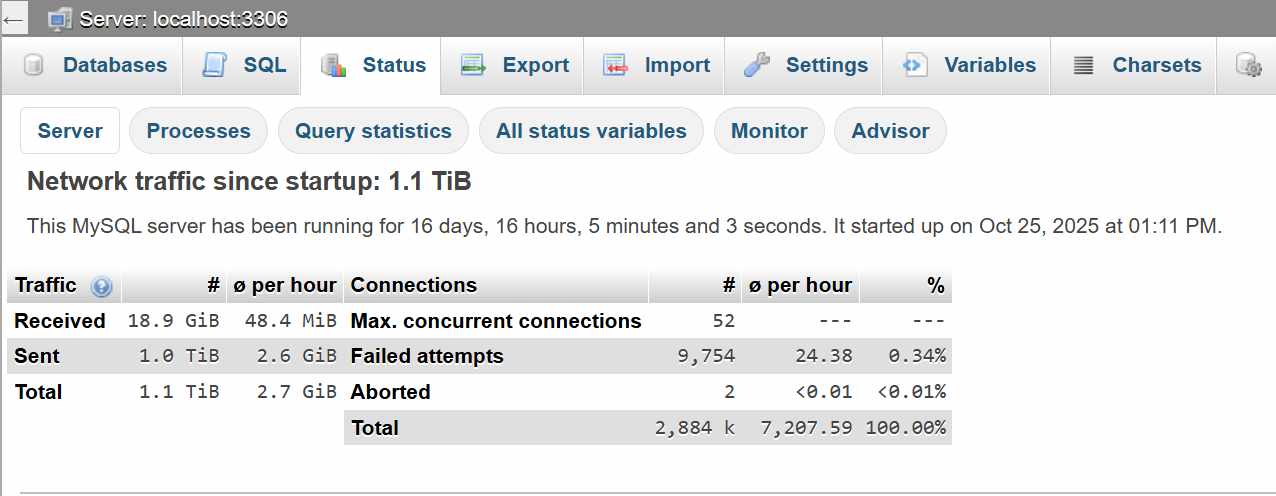
Sejak server MySQL ini dijalankan pada 25 Oktober 2025 pukul 13.11, dengan waktu aktif hingga kini selama 16 hari 16 jam, aktivitas database menunjukkan lalu lintas data yang cukup besar, yakni mencapai 1,1 TiB. Sebagian besar data tersebut merupakan output (1,0 TiB dikirim), sedangkan data yang masuk tercatat sekitar 18,9 GiB. Rata-rata, server mengirim 2,6 GiB per jam, menandakan volume transaksi yang sangat tinggi.
Selama periode ini juga, tercatat 2,884 juta koneksi ke server, dengan rata-rata 7.208 koneksi per jam. Meskipun tingkat kegagalan koneksi tergolong kecil (0,34% atau 9.754 percobaan gagal), volume koneksi yang sangat tinggi bisa menunjukkan aktivitas otomatis atau tidak normal, terutama setelah sebelumnya terdeteksi adanya penyisipan data (injection INSERT) ke tabel wp_posts pada sistem WordPress.
Kondisi tersebut mengindikasikan bahwa kemungkinan besar, setelah injeksi tersebut, skrip berbahaya atau bot otomatis terus mengakses database secara intensif baik untuk menyisipkan data tambahan, melakukan pembacaan (read) massal, atau mencoba memanipulasi isi tabel lain.
Dengan lalu lintas total 1,1 TiB dan aktivitas koneksi yang padat, disarankan untuk segera:
Meninjau log query MySQL (general log dan slow query log) untuk melihat pola aktivitas mencurigakan.
Mengecek tabel wp_posts dan wp_options untuk memastikan tidak ada entri yang berisi kode JavaScript, iframe, atau tautan eksternal yang disisipkan.
Membatasi akses MySQL hanya dari localhost atau IP tertentu.
Mengganti kredensial database WordPress, dan memastikan file konfigurasi (wp-config.php) tidak terekspos publik.
Network traffic since startup: 1.1 TiB
This MySQL server has been running for 16 days, 16 hours, 5 minutes and 3 seconds. It started up on Oct 25, 2025 at 01:11 PM.
Traffic
#
ø per hour
Received
18.9 GiB
48.4 MiB
Sent
1.0 TiB
2.6 GiB
Total
1.1 TiB
2.7 GiB
Connections
#
ø per hour
%
Max. concurrent connections
52
—
—
Failed attempts
9,754
24.38
0.34%
Aborted
2
<0.01
<0.01%
Total
2,884 k
7,207.59
100.00%
Salah satu server database yang dapat serangan injeksi diamati dari stastus Mysql di phpmyadmin
Variable
Value
Description
Aborted clients
2
The number of connections that were aborted because the client died without closing the connection properly.
Aborted connects
9.8 k
The number of failed attempts to connect to the MySQL server.
Created tmp disk tables
937.2 k
The number of temporary tables on disk created automatically by the server while executing statements. If Created_tmp_disk_tables is big, you may want to increase the tmp_table_size value to cause temporary tables to be memory-based instead of disk-based.
Handler read rnd
48.8 M
The number of requests to read a row based on a fixed position. This is high if you are doing a lot of queries that require sorting of the result. You probably have a lot of queries that require MySQL to scan whole tables or you have joins that don’t use keys properly.
Handler read rnd next
15.5 G
The number of requests to read the next row in the data file. This is high if you are doing a lot of table scans. Generally this suggests that your tables are not properly indexed or that your queries are not written to take advantage of the indexes you have.
Innodb buffer pool reads
6.7 M
The number of logical reads that InnoDB could not satisfy from buffer pool and had to do a single-page read.
Innodb buffer pool wait free
5.9 k
Normally, writes to the InnoDB buffer pool happen in the background. However, if it’s necessary to read or create a page and no clean pages are available, it’s necessary to wait for pages to be flushed first. This counter counts instances of these waits. If the buffer pool size was set properly, this value should be small.
Innodb row lock time avg
24
The average time to acquire a row lock, in milliseconds.
Innodb row lock time max
451
The maximum time to acquire a row lock, in milliseconds.
Innodb row lock waits
24.9 k
The number of times a row lock had to be waited for.
Key writes
5.5 k
The number of physical writes of a key block to disk.
Opened tables
611 k
The number of tables that have been opened. If opened tables is big, your table_open_cache value is probably too small.
Qcache free blocks
1
The number of free memory blocks in query cache. High numbers can indicate fragmentation issues, which may be solved by issuing a FLUSH QUERY CACHE statement.
Select full join
4.9 k
The number of joins that do not use indexes. If this value is not 0, you should carefully check the indexes of your tables.
Sort merge passes
3 k
The number of merge passes the sort algorithm has had to do. If this value is large, you should consider increasing the value of the sort_buffer_size system variable.
Table locks waited
50
The number of times that a table lock could not be acquired immediately and a wait was needed. If this is high, and you have performance problems, you should first optimize your queries, and then either split your table or tables or use replication.
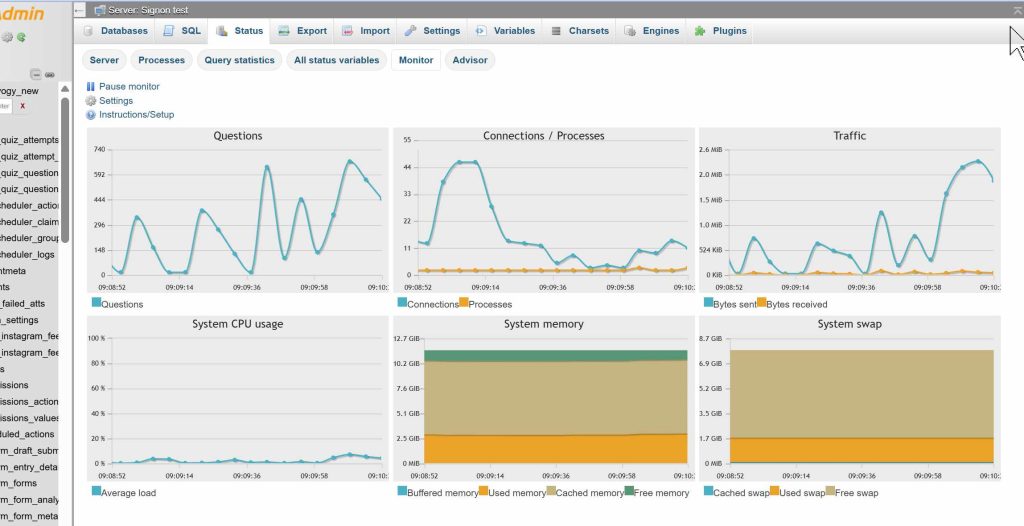
Disamping juga variable bit send dan receive yang tidak normal
Variable
Value
Description
Aborted clients
2
The number of connections that were aborted because the client died without closing the connection properly.
Aborted connects
9.8 k
The number of failed attempts to connect to the MySQL server.
Binlog cache disk use
0
The number of transactions that used the temporary binary log cache but that exceeded the value of binlog_cache_size and used a temporary file to store statements from the transaction.
Binlog cache use
0
The number of transactions that used the temporary binary log cache.
Binlog stmt cache disk use
0
Binlog stmt cache use
0
Bytes received
20.3 G
Bytes sent
1.1 T
Com admin commands
100
Data Stastitik sebelumnya saat serangan masih berlangusung
Materi Kuliah Jaringan Komputer. Berikut ini Materi Kuliah Materi Kuliah Jaringan Komputer di Informatika Universitas Mercu Buana Yogyakarta 2020/2021 pada semeter Genap. 12. DNS dan Kasus DNS Mikrotik 13. DNS, Implementasi di Dinamik DNS Link : Forum dan Detail Materi DDNS 14. TIF46-14-WiFi Link : Forum dan Detail Materi WiFi 15. TIF46-15-Captive Portal Link :…
Berikut ini penjelasan dan contoh sederhana Penerapan VLAN di Switch Router dan WiFi dalam kuliah jaringan Komputer yang disampaikan di Jurusan teknik Informatika Universitas Mercu Buana Yogyakarta. Kuliah Kelas reguler di FTI UMBY Post Views: 5,131
Mikrotik terbaru 2026 menghadirkan berbagai inovasi penting yang wajib diketahui oleh praktisi jaringan, ISP, hingga pengguna rumahan. Mulai dari peluncuran perangkat baru di ajang Mobile World Congress 2026 hingga rilis RouterOS terbaru, semua pembaruan ini menunjukkan bahwa MikroTik semakin serius dalam menghadirkan solusi jaringan modern dan berperforma tinggi. Artikel ini akan membahas lengkap update Mikrotik…
Berikut ini Tugas Mandiri Mata kuliah Manajemen Jaringan, silahkan dikerjakan secara mandiri dan upload tugas di link form dibawah. Silahkan pilih 2 soal saja untuk dijawab. Post Views: 2,439
Berikut ini adalah sebuah contoh penggabungan 2 buah jaringan Lokal (LAN) dengan menggunakan 1 buah Router. Dalam hal ini masing-masing LAN akan menggunakan switch dan bisa dihubungkan dengan banyak PC. Awalnya ada 2 buah LAN yang berbeda network dan akan dihubungkan, karena IP network beda maka perlu Router. Fungsi router dalam hal ini menghubungkan 2…
OLT (Optical Line Terminal) dan ONT (Optical Network Terminal) adalah dua perangkat utama dalam jaringan GPON (Gigabit Passive Optical Network). Selain OLT dan ONT, ada beberapa perangkat dan komponen penting lainnya dalam jaringan FTTH (Fiber to the Home), di antaranya: Post Views: 1,747